TrendCyles' Strategy at a Glance
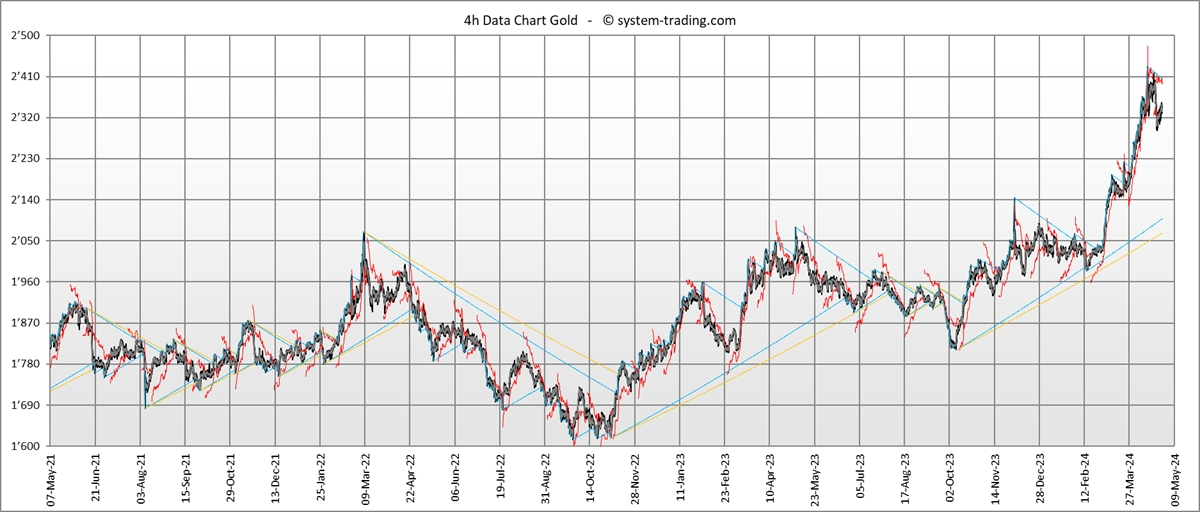
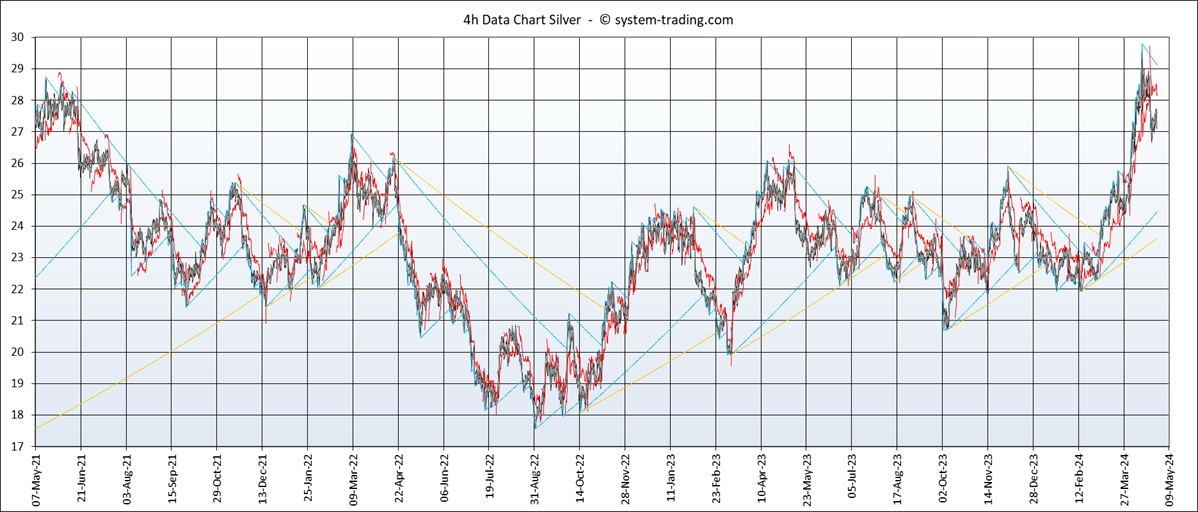
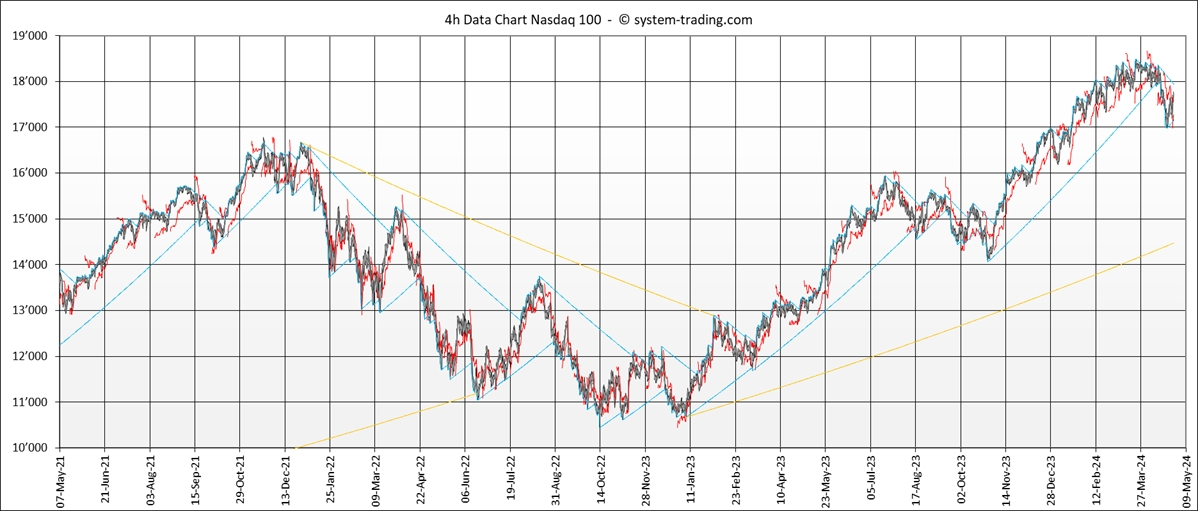
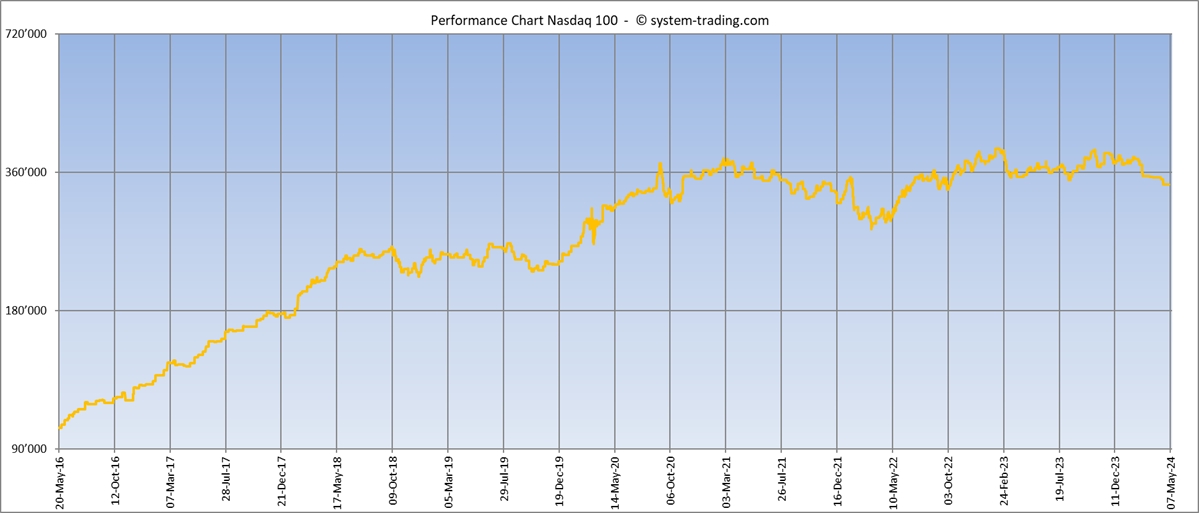
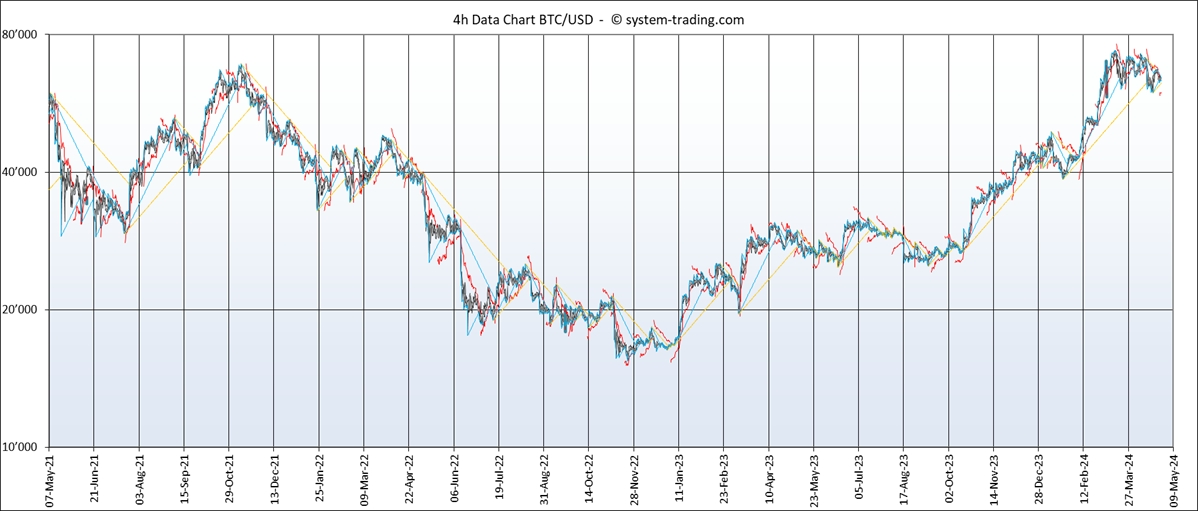
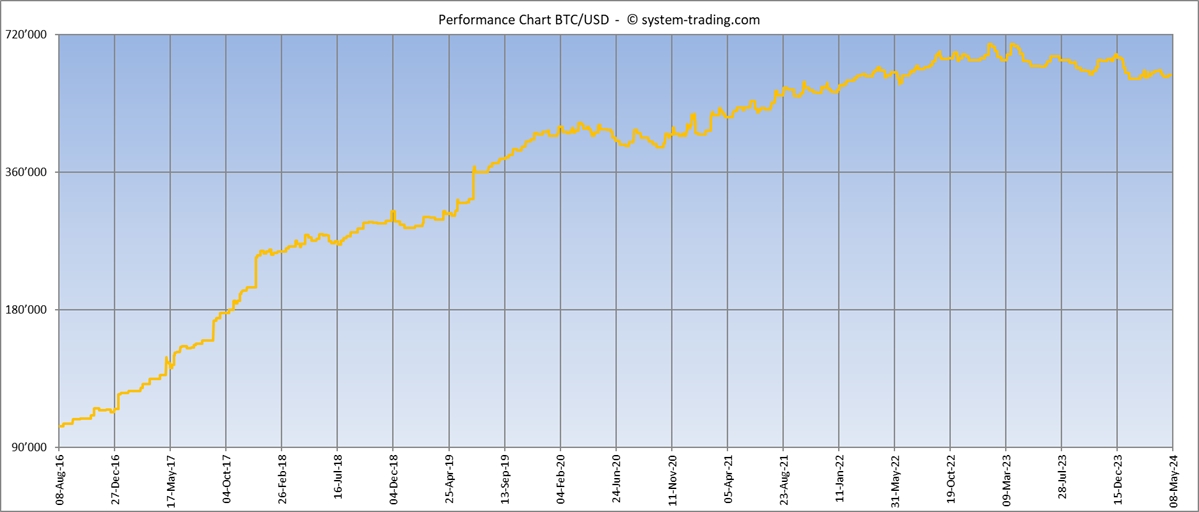
We are pleased to present you a selection of various 3 years charts, based on
4 hours data, indicating the market price development (gray / black), as well as the reversal system stop line
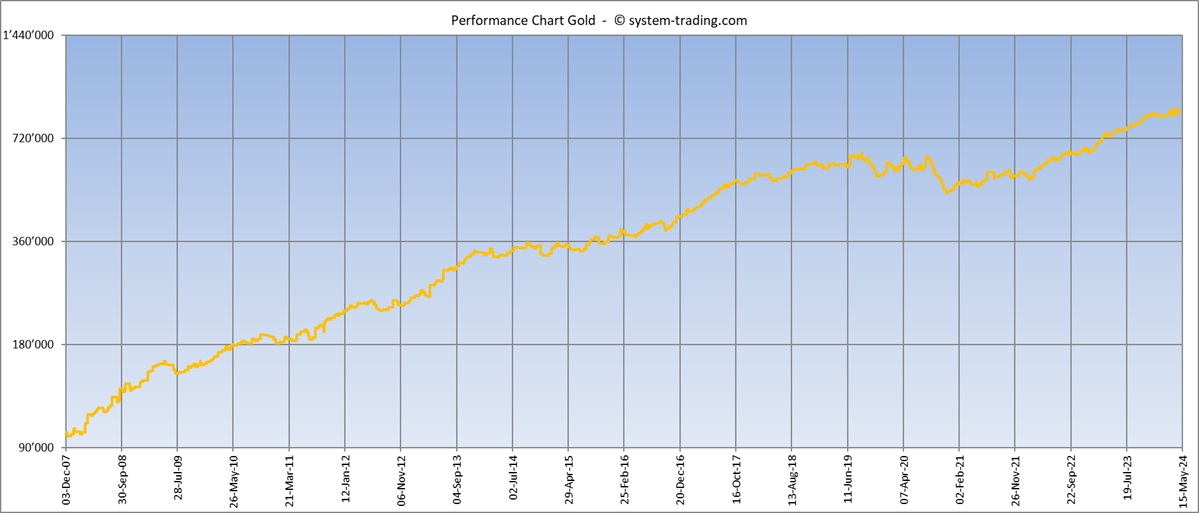
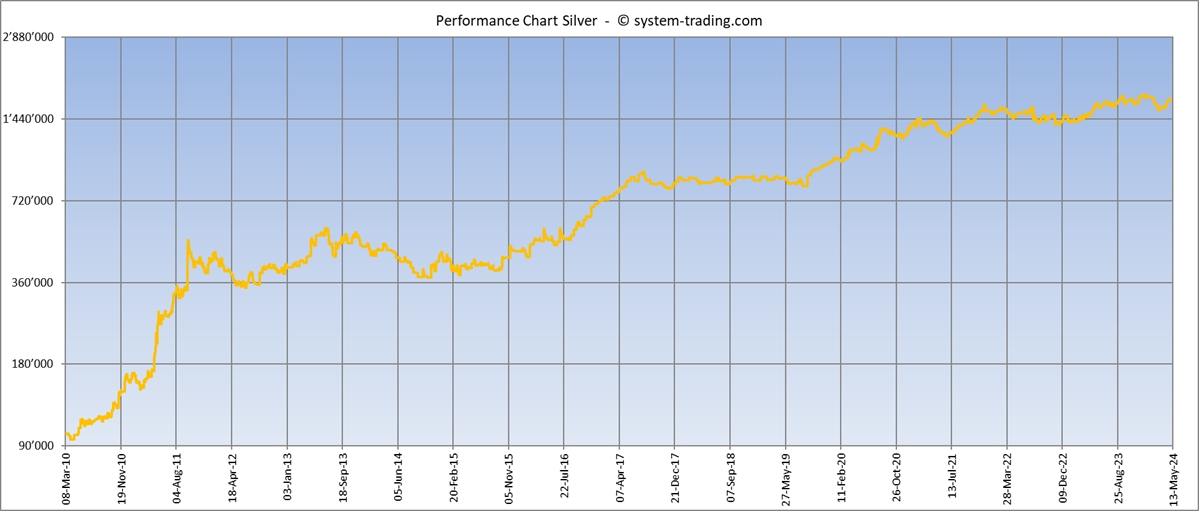
(red) and a major / minor trend line (orange / blue). The system's performance charts are based on 3 % initial stop risk per signal.